Platform on civil engineering, underground infrastructure, energy, construction equipment & construction machinery

How (in)safe is the construction of existing quay walls really? And how can it be predicted in the future how quay walls will move, when risks will arise and measures will have to be taken? These are important questions when it comes to the management and maintenance of quay walls.
The City of Amsterdam hopes to gain insight into this with an innovative test load. The test load will be carried out at a trial location in Amstelkwartier II and should lead to a reliable calculation model that provides a realistic picture of the actual structural condition of quay walls. This will enable the municipality to take appropriate measures in time and prevent the unjustified rejection of part of the quays. A project in which monitoring with smart sensors plays an essential role.
Amsterdam has dozens of kilometers of quay walls that are at the end of their useful life and in poor condition. Given that poor condition, it is imperative that measures be taken quickly, but what measures do all those kilometers of quay wall require? And what is the actual state of structural safety of quays? The City of Amsterdam is faced with the major and complex task of ensuring safety, accessibility and livability in Amsterdam in the short term, while at the same time increasing knowledge about the condition of the quay walls.
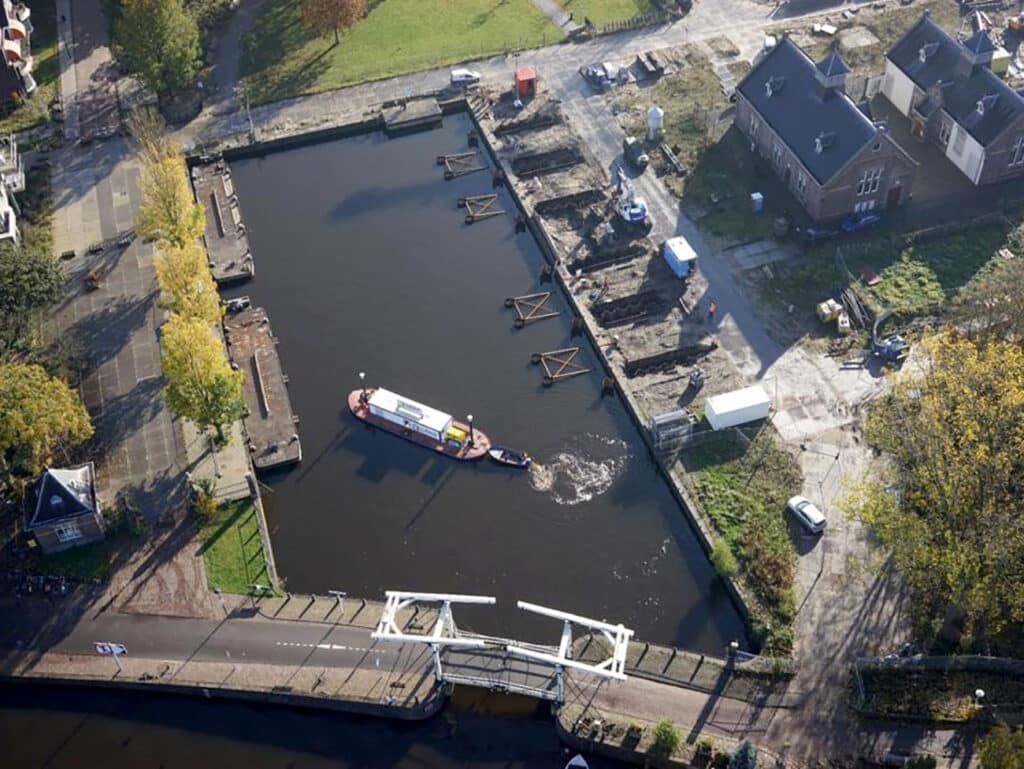
A construction team was formed to conduct the test load. The test was prepared by the AMS institute (Advanced Metropolitan Solutions), a collaboration of various knowledge institutes including TU Delft. Iv-Infra is involved in this test for its knowledge and experience in the field of smart sensors, measurements and structural knowledge of quay structures. The quay wall of the Overamstel dock was chosen as the location for the trial.
The section of quay wall used for this test is approximately 40 meters long. The test load consists of several tests. To assess the effect of each test separately, the quay wall was divided into four similar sections. In the process, the quay wall was literally cut in half, creating sections each about 6.5 meters long. Between each section there is about one meter of space.
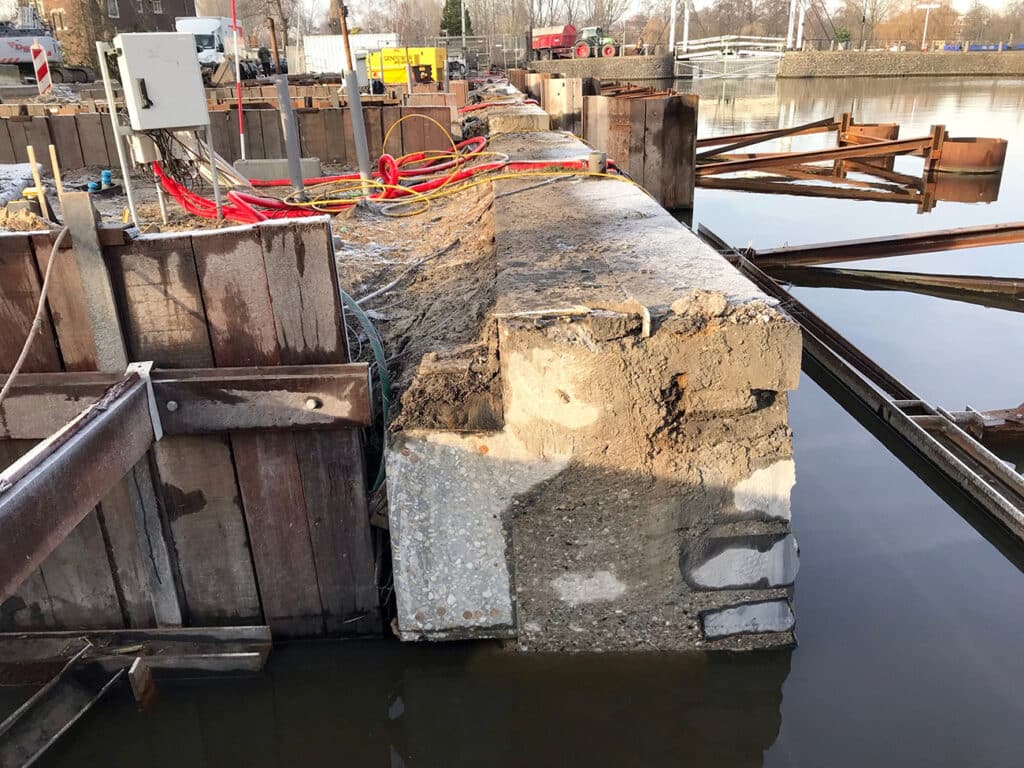
The quay wall consists of a total of four rows of vertical piles and one shoring pile. At two of the four test sections, one row of piles was cut to simulate different situations. In addition, the shoring pile was removed at all sections. Sawing through the brace piles reduces the horizontal strength of the quay wall. This was done to make the quay wall more representative of downtown quays. The older downtown quay walls generally do not have bracing posts.
All the underwater piles, the kesp and the front weight wall were fitted with dozens of smart sensors with the help of divers. These sensors are positioned at strategically devised locations. During the test loading, in addition to the quay structure, the horizontal soil deformation behind the quay, the water level and the pore pressure are measured, so that during the test loading, a detailed picture of the behavior and deformations of the quay wall and the entire soil package behind the quay is created in real time.
For this test, inclinometer sensors attached to the existing piles are applied to measure the skew during the test load. Tilt sensors are also applied to measure the rotation of the quay wall. Prisms and a slope measurement tube are applied to measure the subsidence. Groundwater level and groundwater pressure are measured using monitoring wells and pore pressure sensors. Special vibration measuring systems are applied to measure vibrations, and the facades of nearby properties are fitted with height measuring bolts. Crack gauges provide insight into the distance between two points during the test load, providing insight into whether the quay is moving as a whole or whether parts are deforming individually. .A robotic total station is used to measure the deformation of the quay wall in absolute terms. All of these sensors provide real-time valuable information that is automatically collected and presented in one central platform.
Prior to the test load, TU Delft made a computational model and simulation calculations of the test load. The load at which the quay wall should move forward a certain number of millimeters was also calculated. In order to test this in practice and to gain insight into which top load causes the quay wall to move and how this happens exactly, more and more weight is added step by step during the test load. This is done until the moment when the displacement is such that the quay wall would theoretically collapse in a controlled manner. It is expected that the quays will deform by 30 to 70 centimeters. At 30-40 centimeters is the calculated breaking point: the moment when the quay wall and piles collapse.
Within each test section, a different situation is simulated. For example, ballast is placed at different distances from the quay, water bottom depth is varied, and the effect with and without tree roots is examined. A test is also being conducted on individual piles to measure the horizontal resistance of an individual pile. The test loads are now in progress. The data obtained from the test loads is an essential basis for eventually arriving at the new computational model.