Platform on civil engineering, underground infrastructure, energy, construction equipment & construction machinery

When testing and designing regional flood defenses, water boards often use conservative assumptions to establish a schematization of the phreatic surface for various normative conditions. Although the 2004 Technical Report on Water Tensions at Dikes of the Technical Advisory Committee for Flood Defenses (TAW-Technique) explains the usefulness and necessity of field measurements and modeling in detail, this is generally not done. Why not? And how can hydrological measurements and modeling be applied in practice for optimization of a levee improvement?
Hoogheemraadschap van Rijnland (HHR) manages more than 1,200 kilometers of regional flood defenses, of which about 150 kilometers will have to be reinforced in the coming years. A large part of these are basin dikes that have been rejected for the failure mechanism Macrostability Inward. With this failure mechanism, the strength of the soil decreases due to higher water pressures (usually as a result of high water levels or extreme precipitation), causing the soil-body to lose equilibrium and part of the dike to shift. To determine whether a dike meets the desired standard, a stability calculation is made under normative conditions. An important factor here is the location of the phreatic plane, or the level up to which the body of soil is saturated with water. Because this location is difficult to determine in practice, simplified (conservative) assumptions are often made for this, based on recommendations from TAW 2004. The same schematisation is used for various types of dikes, whereas the width of the barrier or the presence of a road, for example, can have a great influence on this. This means that for many barriers the available stability may be underestimated, which may lead to unnecessary rejection of parts of the barrier, but also to unnecessarily heavy reinforcements..
In 2018, HHR started a project with engineering firm Iv-Infra and water consulting firm Nectaerra to determine the groundwater schematization under normative conditions based on field measurements and modeling for some dike sections in the ongoing improvement program. This will investigate whether and how these insights can be used to optimize the groundwater schematizations for the entire improvement program.
Based on the improvement program, 7 representative levee sections (measuring turns) were selected in four polders. A distinction was made between three types of levees:
1. Wide barrier with a road on the crest and a large retaining height;
2. Wide "green" barrier (with no road on the crest) with a large retaining height;
3. Narrow barrier with relatively small retaining height.
Within this distribution, additional differences in soil composition, and toe ditch spacing and water elevation are also considered. During the study, the decision was made to use more conventional and widely used methods of measurement, such as logging wells and soil classification borings. Geophysical detection methods and in-ground pore pressure gauges or soil moisture meters were not used at this stage.
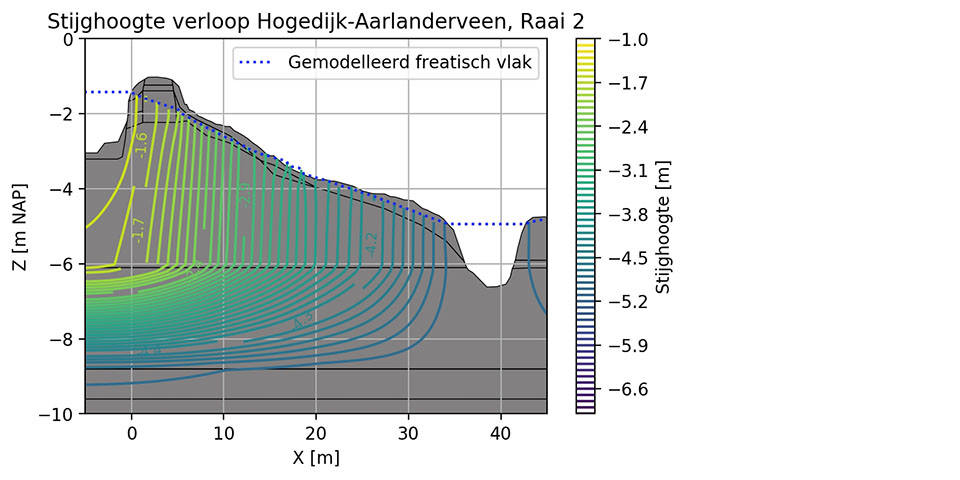
Modeled head gradient and location of phreatic plane.
Based on existing elevation data, borings and soundings, 2D soil profiles were drawn up, with which the locations of monitoring wells and filter depths were chosen. This involved estimating horizontal and vertical groundwater flow and taking into account the lowest measured groundwater level. To ensure that a filter was not located in multiple soil layers, 50-cm filters were used. Loggers were used to automatically record water pressure every 10 minutes. Rain gauges were also installed. The XYZ coordinates of all measurement locations were measured with DGPS and leveling. To include variation across seasons, it was decided to measure one year before determining the schematization. This period included the very dry summer of 2018 and some extreme precipitation events, including a maximum precipitation of 96 mm in one day in one of the rain gauges, which has a recurrence time of 100 years (Precipitation statistics and series for water management, Stowa, 2019). In the field, porosity and (saturated) permeability of different layers and locations were also determined using soil core tests, slug tests, double ring measurements and Amooza measurements. To better include the effect of road construction and permeability on groundwater flow, asphalt and cunet borings were performed and one road was fully measured with 3D ground penetrating radar.
In addition to the measurement program, a groundwater model was set up for all the grids using MODFLOW. An important issue arose during the selection of hydraulic boundary conditions and the validation of the models, namely for exactly which precipitation and infiltration conditions the high water situation was to be modeled.
After all, the existing guidelines describe a normative storage basin water level, but no normative precipitation. Ultimately, we chose to solve this conservatively by imposing a continuous precipitation of 10 mm per day, and determine the steady-state groundwater level for this.
Primary factors affecting the location of the phreatic surface appear to be external water levels and head of the first aquifer, in addition to the geometry of the dike. Of more secondary importance are differences in soil composition and hydraulic parameters.
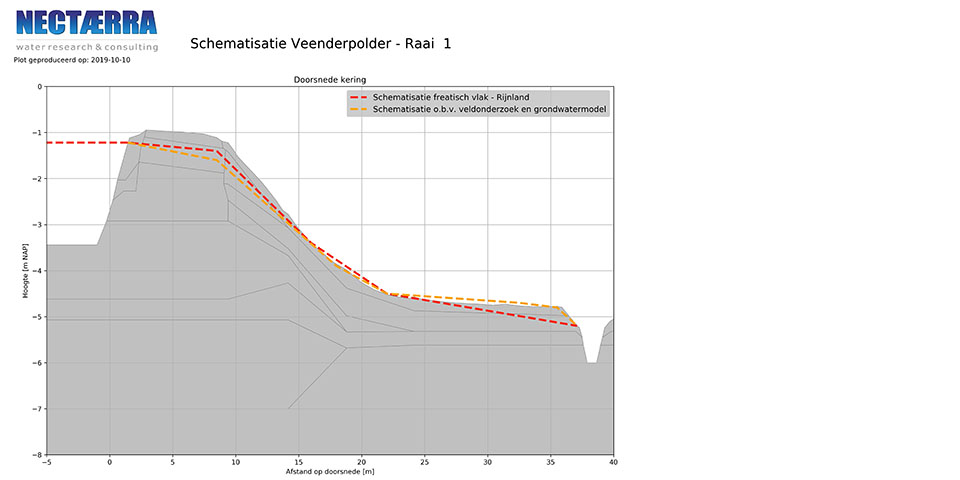
Schematization phreatic surface according to current calculation rules HHR (red) and based on field research and groundwater model (orange). The illustration shows the head, where it is above ground level seepage and runoff occurs.
After the measurement period, three schematisations at high basin level were prepared for each measurement run and compared:
a. The phreatic groundwater gradient according to existing design guidelines of HHR
b. The phreatic groundwater gradient according to the highest measured water level in the monitoring wells
c. The phreatic groundwater gradient according to the groundwater model (including precipitation).
After calibration, measured and modeled phreatic surfaces were found to be in good agreement. Based on the comparison between the measurements, model calculations and schematisation according to existing design guidelines, it is concluded, especially for the wider flood defenses, that in current practice the height of the phreatic surface at the inner crest is slightly overestimated and at the inner toe it is underestimated.
The effect of this on the stability of the water barrier has been clarified with a number of stability calculations. Although the results differ per levee, in most of the cases studied, optimization of the phreatic surface leads to an improvement of the stability factor by several hundredths, resulting in a less severe embankment reinforcement. For one of the dikes studied, this optimization would result in a savings of 2-3 m3 clay per linear meter, or several thousand cubic meters of soil for the entire reinforcement. Research costs were estimated to be at most 10% of this savings.
Iv-Infra and Nectaerra are currently conducting follow-up research, in which a new calculation rule for both high water and low water will be determined for the entire improvement program based on the findings. This will also take into account other important differences between dike sections, such as the presence of certain weak soil layers, variations in the head of the first aquifer and distance to the toe ditch.
Given the differences in phreatic surface for each type of dike, in addition to optimizing the standard schematization, it seems to have added value for future embankment reinforcements to use a combination of measurement and modeling to determine the phreatic surface "tailor-made": the extra effort at the front end will probably pay off many times over through optimization of the design during execution!
Louwers Mediagroep
Schatbeurderlaan 6
6002 ED Weert